
Coinbase - share price movements
An astrological analysis of the Coinbase share price fall on 9th November 2021 and the rises that preceded it in October.
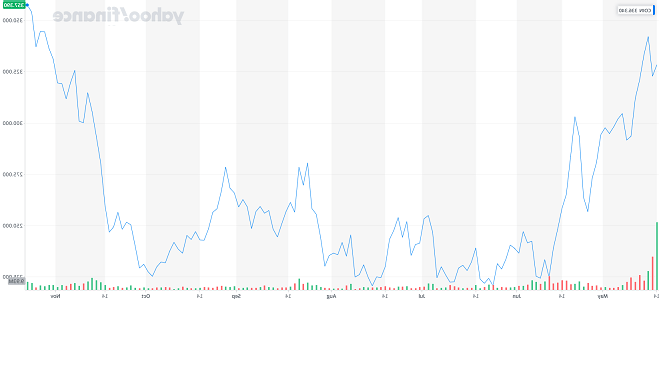
I already had Coinbase on my to-do list for November, but its sharp fall in stock price yesterday at 10am, after the third quarter results announcement, albeit followed by a quick recovery, encouraged me to bring my analysis forward a few weeks. In any case the fall was in the context of a significant rise since early October.
We are, of course, looking at another corporation and with that comes the problem of choosing a good chart.
Coinbase as a concept was started in 2011, but it wasn’t until 2012 that the founder took on a partner, raised some funds and business began.
Even the Coinbase blog is a bit vague and doesn’t mention the first date of offering vault services. It does, however show the date it first offered the ability to buy and sell via a bank account: 26 October 2012. In the absence of a time we can use noon in SF.
The incorporation of Coinbase was in Delaware as 27 January 2014. I am a bit sceptical about the usefulness of these dates ( as they are a legal formality only) but we will look at it nonetheless.
The IPO first trade took place on 14 April 2021 in NY at midday ( due to it not being a full public offering). That one should work well but of course was only 7 months ago so not terribly revealing in terms of outer planet transits.
It is important to understand what these charts ( and their equivalent in other companies) represent. At the time of the first chart there is no incorporation and no shares. While the chart may well link to later charts that connect to the share price- this chart does not do so. It is purely a chart about the nature of the business activity, the founders and the potential for success for the business.
It behoves us to remember that it is entirely possible for a business chart to look good but for an IPO chart for the same company to be negative, if that IPO takes place at far too high a price.
The incorporation chart is, as mentioned, a legal formality, probably done for tax and employment purposes. It is difficult to scale significantly without incorporation but it may tell little about the business itself. I do believe though that over a long time period a company does grow into its incorporation chart as the business and brand becomes synonymous with the legal entity. Coinbase is unlikely to have reached that point, Coca Cola probably has.
The Incorporation chart does have its uses though, it is a perfect chart for looking at taxes, legal cases and other non-business related matters.
Finally the IPO or first trade chart. This absolutely says something about the shares. It may well represent more than just the price though, it certainly gives indication of the demand. It should ideally link to the business chart- otherwise you can suspect that there is something odd happening.
Anyway , back to Coinbase and let’s start with the 2012 chart.
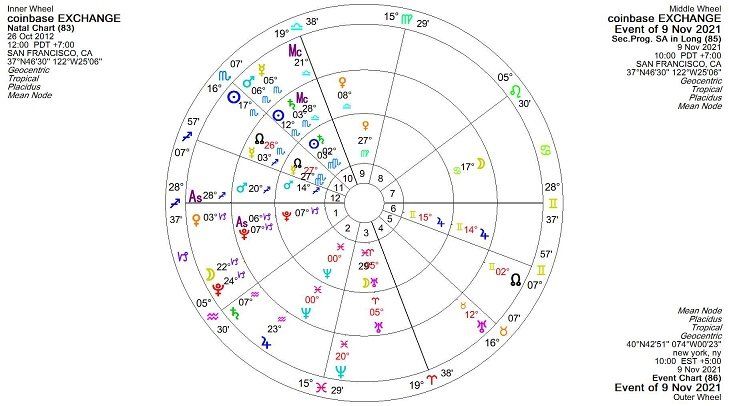
Wow. Even though I have used a midday chart for the initial business, the chart for 9 November at 10 am has the same angles. That is really quite extraordinary. Though of course one swallow does not make a summer.
We also note that the progressed Ascendant this year has reached the chart Pluto. Though that is about the wider changes in the company not yesterday’s stock price.
For that we need to look at some inner planets. We see immediately that the transiting Mercury and Mars are quincunx Uranus. That alone is enough to give a sudden movement. The fact that it picks up the progressed Ascendant Pluto point for a few days also increases the probability of significant movement. We can also note that the day was highlighted by the transiting Sun in a trine to the progressed Moon – the latter probably saved the Stock from a bigger shock.
Less obvious is the fact that Mars/Mercury at 5 degrees of the fixed signs are at 45 degrees, a semi-square, to 20degrees of the mutables. So as well as activating the chart themselves, they are also in communication with Neptune at 20 Pisces.
Indeed Mercury is exactly semi- square progressed Mars at 20 Sagittarius activating the ongoing square between Neptune and that progressed Mars. This configuration suggests confusion over levels of trade ( not trade in the shares but in the business) and that was confirmed by the announcement which suggested activity was down significantly on expectations.
We can probably expect more change in the next few days, as Mercury and Mars move to 12 degrees conjunct the progressed sun and opposite the Coinbase Uranus.
A quick look back at Mid October is also merited. We can see that at that time the Sun was conjunct Mars in the sky as well as being trine transiting Jupiter and they were both close to the MC of the chart and sextile its progressed Mars. But the only other notable transit was of Venus at 12 degrees Sagittarius. Perhaps there was no foundation to the rises in October that shows in the chart of the business itself?
Turning then to the Incorporation chart, what do we find?
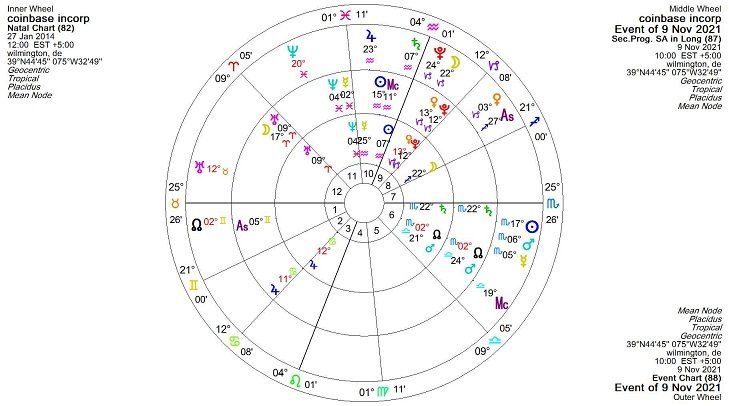
This time we see that Mercury and Mars once again pick up the progressed Ascendant. We also note that this puts transiting Saturn on the MC at the time of the price fall. And we see the Sun is, this time, Quincunx the progressed Moon.
As I suspected though, the Incorporation chart is not as useful.
However, we can see again that 12 degrees is prominent and so confirms that the next few days could be interesting.
Turning to the First trade chart
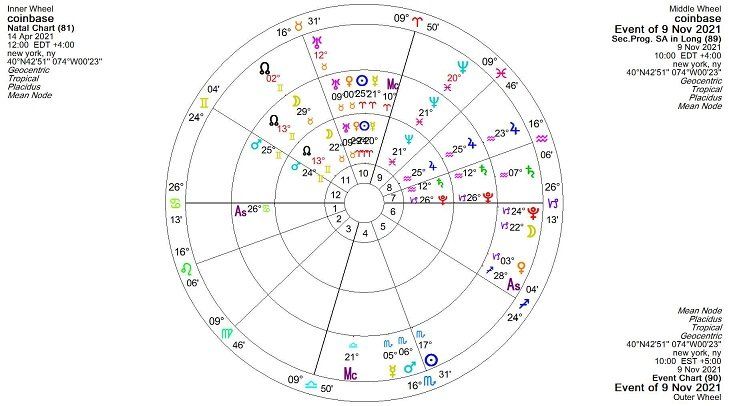
The outer planets and progressions are mostly of little use as they are little changed from April. Even though they shout drama with Pluto on the Descendant square Sun quincunx Mars. There is a lot going on at 24-26 degrees.
We can see though that Uranus at 12 degrees is currently square the Coinbase natal Saturn- that certainly suggests a shake up around now ( and even more so in the next few days!) - though doesn’t indicate the exact date. Although Mercury and Mars oppose natal Uranus, it is not exact on 9th November .
However, we know that they are also in semi-square type aspect with Neptune ( both natal and transiting).
And that leads us to the timing of the fall in the chart though. As the transiting MC opposes Mercury and is quincunx Neptune. We also see that the Moon is square the transiting MC at that time. They are very short term indicators – so not surprising that the stock price recovered. But I am more concerned by the fact that once more 12 degrees is highlighted in the coming days.
Looking back again over October’s price rises. We see the major rises occurred when the transiting Mars/Sun was in the region of 20-26 Libra activating those degrees I previously mentioned. Jupiter was at 22 degrees as well emphasizing the connections. It is also of note that Mercury stationed at the IC of the chart at that time too. Certainly enough to suggest activity although operating with both Neptune and Jupiter, as we know, is to set oneself up an illusion. Perhaps there was no fundamental value to underpin those rises.
On balance, though , this is definitely an interesting chart and interesting times. One can’t help but ask, no just what will happen this week when 12 degrees is reached but what will happen when :
- Pluto goes back over the Descendant at the end of the year.
- Neptune moves forward to 23-24 degrees and Jupiter conjoins it in April 2022
- Uranus and Jupiter conjoin at 23 Taurus in 2024
For answers look to our services.
OPTIMESIA