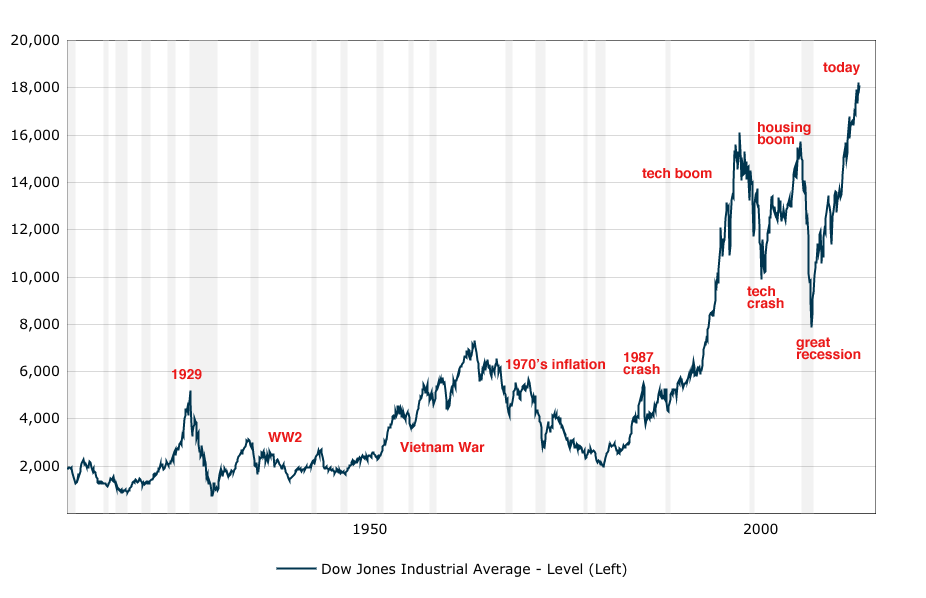
The Dow Industrial Index: a retrospective
A look at significant events in the history of the Dow
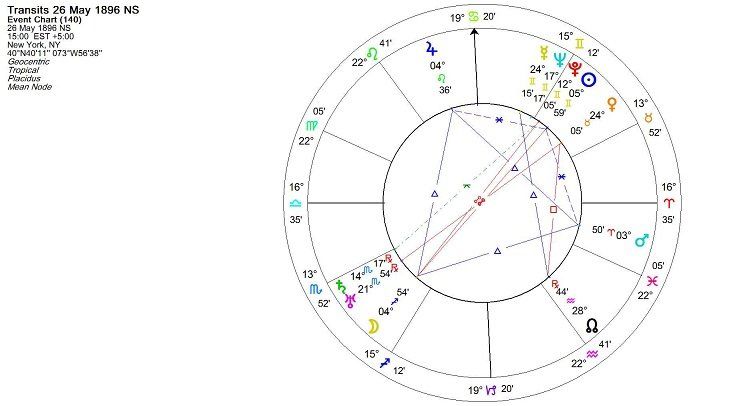
A couple of things immediately stand out; the chart contains a kite formation which includes a grand fire trine of Jupiter/Moon and Mars around 4 degrees and the Sun at 5 Gemini. This is a fairly strong signature, something that should not surprise us much 125 years later.
In addition, the chart is set a few years after the Pluto Neptune conjunction but the planets are still close enough to resonate with it- we can’t just consider it alone, we must see it as part of the greater cycle.
We also need to be aware that there is potential for value shocks with Venus opposite Uranus and widely picking up both Neptune and Mercury- elements which will come into play as progressions tighten the relationships.
Finally we note a less obvious threat, as the MC/IC axis is 45 degrees from the Moon providing both points of opportunity and risk for the future.
Thus we can expect the chart to resonate to the broader cycle of Pluto and Neptune, but it will also respond to Saturn/Uranus and Jupiter.
1929
We’ll give the first couple of decades a miss then and turn to the conditions of 1929. We can immediately notice the problems here.
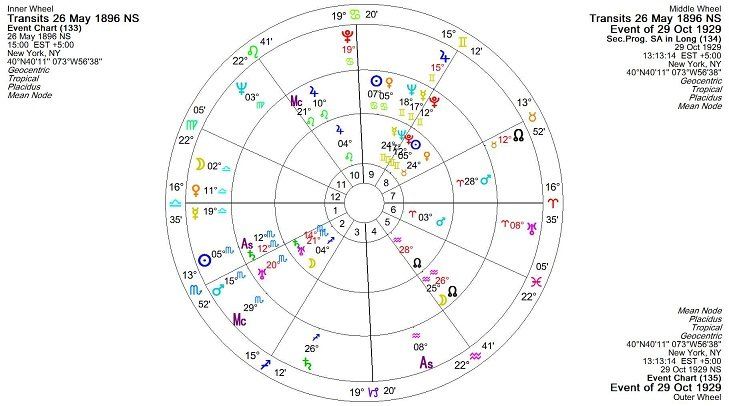
Pluto appears on the MC, and the chart’s progressed Ascendant has reached its progressed Saturn. That is enough to depress anything. We note how Mercury at 19 Libra is activating the Pluto on 29 October 1929. But we also see that Neptune is sneakily positioned at 3 degrees Pisces – this does not mean things will be negative but it does mean that whatever the conditions are, they are likely to drag on and Neptune is a weakening influence- here it is weakening that strong kite configuration.
But we should also not omit to notice that Pluto and Neptune have reached a semi-square of 45 degrees to each other – the first tough aspect in our wider cycle.
And that is a perfect point to start considering those outer planet cycles in more depth. They aren’t the whole story ( if they were all the markets would always move together!) but they do form a big part of the long term picture.
The markets took 2 decades to recover from 1929 but they really started to do so from 1950, and that marks the first Pluto Neptune sextile. Its first outing within orb lasted till around 1956, enough time to give the Dow a big boost, though we need to acknowledge that Neptune square Uranus also operated in 1954-6.
Our next big aspect was Pluto conjunct Uranus in 1965 signifying technological transformation among other things. And our next chart is set for the Dow peak in 1966 at close of trading hours again ( at 3.30pm EDT or 14.30 EST).
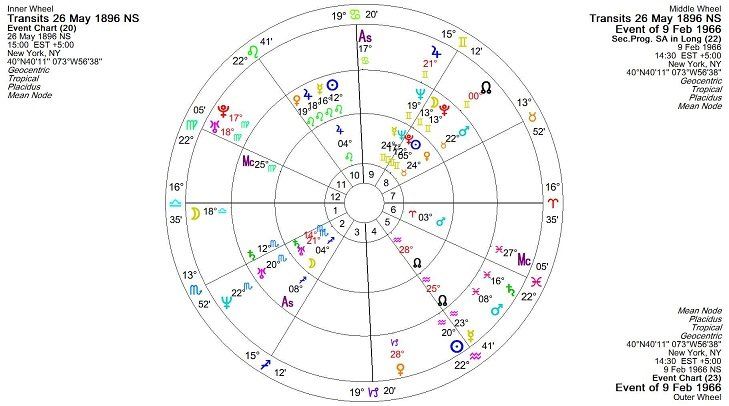
As well as the obvious Pluto Uranus conjunction opposing Saturn – a pretty significant configuration of itself, we note that that configuration is square the Dow Neptune but it also picks up the progressed Mercury/Jupiter conjunction. Change was happening in a big way and the market was not immune to the shifts in influence.
We can also see immediately that our old friend Neptune at 22 Scorpio is conjunct the Dow Uranus and opposite both Venus and progressed Mars. Jupiter at 21 Gemini is activating this but the significant triggers for the day are transiting Sun square Uranus and transiting Mars square the progressed Ascendant.
Note also the Moon and transiting Ascendant picking up the chart’s angles. Not surprising that we had reached a critical turning point.
October 1987
Although the crash of October 1987 was a flash in the pan crash and not exactly what we are trying to analyse here, it is worth taking a peak at the chart for completeness sake.
I’ve set this one for morning opening (9.30EDT – 8.30EST) as the market starting falling from opening.
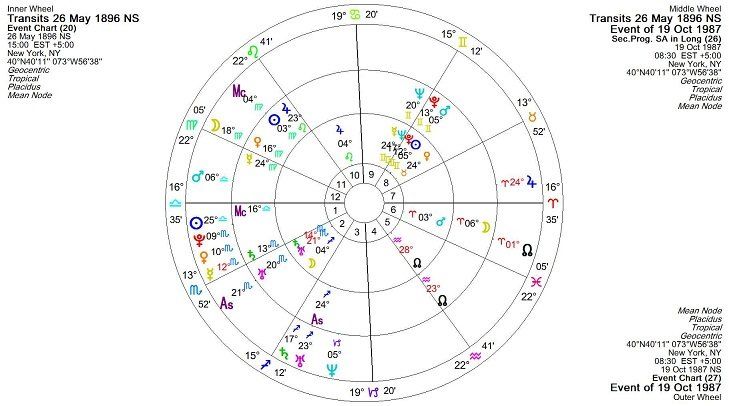
Note the impact in this case of transiting Uranus conjunct the Progressed Ascendant and opposite the Dow Mercury- enough even by itself to create shocks. But transiting Uranus is also square progressed Mercury and picks up a trine to progressed Jupiter not to mention the transiting Jupiter around that time - in this case those Jupiter trines were not beneficial but magnifying. But if this wasn’t enough, we love a double whammy and we have one, the Ascendant at opening conjunct the progressed Uranus.
There is more, we can see that the Sun has just passed a sextile to transiting Uranus which has kicked things off before trading starts. We can also see that the Moon is square Saturn that morning and Saturn opposes the Dow Neptune. WE even have the progressed Sun on the Midheaven at the start of trading.
Not surprising then that the day and the weeks that followed were a case study in drama in the market. The only thing I would question is why 1001 astrologers didn’t point it out beforehand. Or perhaps they did and no-one was listening.
After 1987 things turned positive again and despite the recession of the early 1990s, by 1995 Greenspan was talking about irrational exuberance. The benefits of the Uranus Neptune conjunction (after Saturn had moved away), especially when activated by Jupiter in 1997 meant that even Pluto transiting the Moon couldn’t stop the market rising ( although it did create some sceptics who it was alleged “didn’t get it”). It was different this time!
That all came to an end in 2000. Note how the Dow reached its peak two months before the Nasdaq, an indicator that there was more delusion affecting the latter than the former.
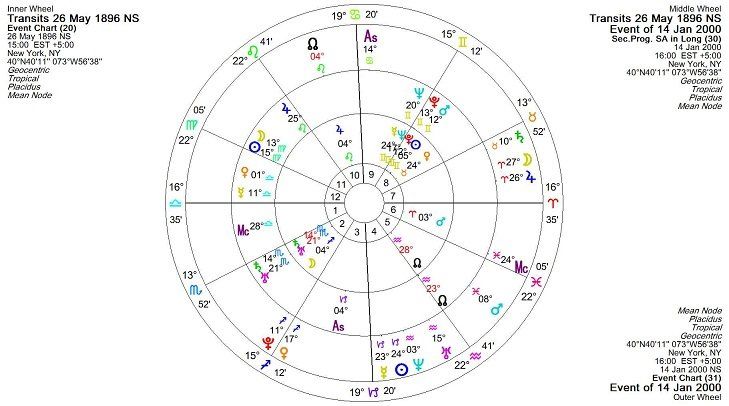
This is a chart for the peak, not the bottom. We should expect to see indications of a major turning point.
We do see that Uranus at 15 Aquarius is square the Dow Saturn. It is also quincunx progressed Sun at 15 Virgo, tying things down to the year in question. At close of business on 14 Jan we can see that the Ascendant is 14 Cancer activating this.
Transiting Pluto is sextile progressed Mercury but it is also almost opposite progressed Mars and Pluto. Over the coming years it will pass over these continuing to depress values and even weed out weaker components. The progressed Moon was activating that conjunction during January 2000 setting the process off.
We can also see that the Moon has just made a conjunction with Jupiter earlier that day, that is a monthly event, but in this case we see the conjunction is opposing the Dow progressed Midheaven and is trine the progressed Jupiter. Big changes are afoot and affecting the angles of the chart – i.e creating conditions for a turning point in sentiment. With The transiting Sun and Midheaven of the moment within 2 degrees all the condition are set.
We can also see that Neptune at 3 Aquarius is approaching the kite in the chart- it has reached Mars at 3 Aries but the coming year will see it move over all the 4 planets as well as the progressed Ascendant. This was a very key time.
2008-9
Then we turn to 2008-9 and the Global Financial Crisis. I’ve set the chart for the bottom on March 23, but any of the significant dates in September and October 2008 would be valid while showing a rather different emphasis..
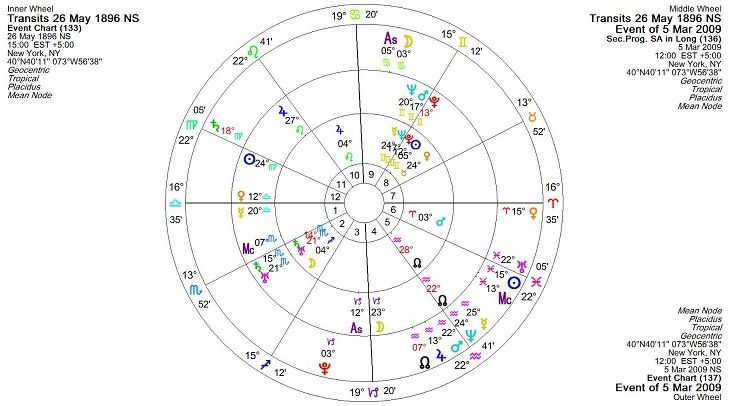
We can immediately see Pluto tucked away there at 3 degrees Capricorn, putting a little pressure on the Kite formation and particularly on its Mars. On that day the Moon opposed Pluto too. But other factors are not so obvious, or rather they don’t seem clustered around 4 or 19 degrees.
However there is a configuration that involves the Venus –Uranus opposition in the chart. This is now being squared by Neptune (activated then by Mercury and Mars) opposite Jupiter. However Uranus ( widely conjunct the Sun) mitigates this somewhat. On the other hand it opposes the progressed Sun and squares Neptune/Mercury. Similarly Saturn which opposes Uranus. It seems these factors more or less outweigh each other – But then they should as the bottom has been reached.
There is one more factor, however, that should not be ignored and is part of the story in this period. Progressed Mars has reached natal Neptune. That is once again a key sign of ongoing weakness. Indeed we can see that we have 2 Neptune/Mars conjunctions ( progressed and transiting) so yes this does make a good low. Though it may also pertain to the increased liquidity that will flood the system over the coming years.
In 2010-2013, people, including many astrologers were negative about the prospects for the markets. I, on the other hand could see no real weakness either in 2010-2012 or 2013-16. Even in 2020, when there were definite signs of financial difficulties, my concerns were mainly more for currencies than stocks.
Let’s explore again why I was less concerned. Here is the chart for July 2010 when the cardinal cross was at a peak.
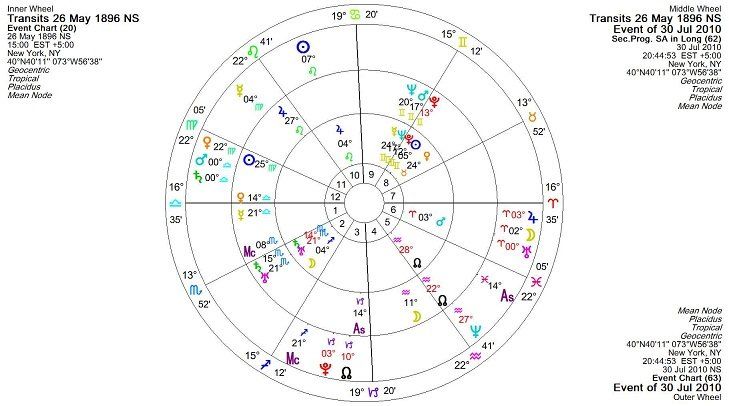
We can see that at this point the Cross was clustered around 0 degrees to 3 degrees of the zodiac. We would expect it to affect the kite in our Dow chart, if not in 2010, then in by 2012 as the planets moved a couple of degrees onwards.
But as mentioned at the start of this analysis, the Kite formation is a strong one. And what we see in this chart is that, although Pluto in Capricorn makes a hard aspect to Mars and is quincunx both the Dow Sun and Jupiter, and although we see Uranus (and Jupiter) conjoining Mars, we also note that Uranus will sextile the Sun, Trine Jupiter and Trine the Moon. Similarly Saturn ( with Mars) will oppose Dow Mars but will sextile the Moon, sextile Jupiter and Trine the Sun.
The kite formation protects from harsh aspects by compensating with softer ones. In this case quantitative easing took away the sting of the crisis and the Dow was able to recover.
We see the excess liquidity in the chart as Neptune opposes the progressed Jupiter. A blessing, but in the long run perhaps a mixed one. We will see.
2020
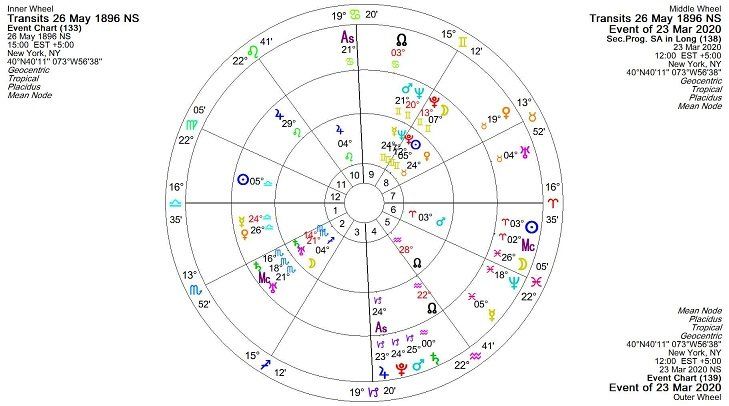
Next we turn to 2020. And specifically March 2020 when the Covid fears and their effect on the market were at their peak. The chart is once again set for the low- after 2 weeks of falls. Our initial focus is the Pluto/Jupiter conjunction activated by Mars on the progressed Ascendant and square the progressed Mercury Venus conjunction. . Obviously this Pluto configuration is the Covid one, but why did it not persist?
We must also turn to the other factors – why are the falls at their peak at that time, not earlier or later? We immediately see Uranus at 4 Taurus activating the kite configuration. But on that day the Sun is conjunct natal Mars at 3 Aries. Progressed Sun is in opposition at 5 Libra and we have further activation at 5 Sagittarius by Mercury. Indeed we must also note Venus at 19 Taurus too.
Note the difference between this Uranus at 4 Taurus and the previous chart Uranus at 0 degrees Aries. Then the position of Uranus tapped into the positive aspects of the Kite. This time It creates a square with Jupiter, an opposition with the Moon, a quincunx with the progressed Sun and only some semi-sextiles to offset. This is a much harsher prospect, albeit triggered by quick moving Sun and Mercury and with Jupiter creating the potential for major swings which could be positive ( and were by the following month or so) despite the pressures from Pluto.
So where next? We can once again set a chart for 9 August 2026 as we did with the Nasdaq.
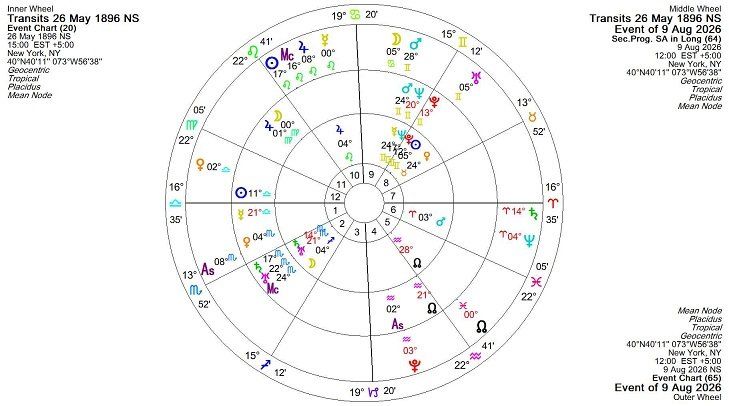
This is an extraordinary chart in its synastry with the Dow’s kite formation. Pluto is at 3 Aquarius, conjunct the progressed Ascendnat Neptune at 4 Aries conjunct Dow Mars, Uranus at 5 Gemini conjunct Dow Sun, Jupiter is at 8 Leo widely conjunct the Dow Jupiter. But we can also note that progressed Venus has reached 4 Scorpio and even the progressed Moon will soon be at 3-4 of Virgo.
Add to that a transiting Saturn crossing the Descendant axis and we have the conditions for a very significant event or environment. Be prepared.
OPTIMESIA